Introduction
In Part 4, you secured Traefik as the reverse proxy, and in this blog, you’ll deploy the ELK Stack in your OpenShift cluster. The stack is comprised of Elasticsearch, Kibana, Beats, and Logstash. When used together, these components are most commonly used for monitoring and troubleshooting your environment. Beats and Logstash take care of data collection and processing; Elasticsearch indexes and stores the data, and Kibana provides a user interface for querying the data and visualizing it. For a small-sized development environment, the classic architecture will look as follows:
Beats (Data collection) -> Logstash (Data aggregation and processing) -> Elasticsearch (Indexing and storage) -> Kibana (Analysis and visualization)
But for handling large amounts of data in production, an additional layer is likely to be needed for resiliency (Kafka, RabbitMQ, Redis):
Beats -> Kafka (Buffering) -> Logstash -> Elasticsearch -> Kibana
A Brief Introduction to Elasticsearch
Why is there a need for a centralized cluster-level logging stack? Well, debugging in a distributed system is extremely difficult since attaching a debugger to a process is not as easy, when compare to a monolithic application, because there might be hundreds of processes (instances of the same microservice); e.g., on which process are you going to set the breakpoint? Still, debugging microservices is essential. When running multiple services on a Kubernetes cluster, a centralized cluster-level logging stack can help you quickly sort through and analyze the heavy volume of log data produced by the microservices. Elasticsearch (ES) is a distributed open-source search and analytics engine that is built on the Apache Lucene library and developed in Java. ES has long been the prominent solution for log management and analytics. This deployment will be a typical production-level Elasticsearch cluster consisting of master pods (3), data pods (2), and client pods (2); hence, you’ll need a Kubernetes cluster with a minimum of seven (7) nodes.
Whenever you create an instance of Elasticsearch, you are creating an Elasticsearch node. A collection of connected nodes is called a cluster, and a node can only be a part of one cluster. If you create a single instance of Elasticsearch, then you have a cluster of one node. If you do not set the node roles, the node is assigned all of the roles (master, data, ingest, etc.). By default, every node in the cluster can handle HTTP and transport traffic. The transport layer is used exclusively for communication between nodes; the HTTP layer is used by REST clients.
Master Nodes
A master node is eligible to be elected as the master node thereby controlling the cluster; there can only be one node serving in the master role at a time. The master node is responsible for creating or deleting an index, tracking which nodes are part of the cluster, and deciding which shards to allocate to which nodes. Electing a master node and changing the cluster state are fundamental tasks that master-eligible nodes must work together to perform. Elasticsearch achieves this task by considering each action to have succeeded on receiving responses from a quorum, which is a subset of the master-eligible nodes in the cluster. By requiring a quorum, some of the nodes can fail without preventing the cluster from making progress. Furthermore, the quorum is chosen so the cluster does not have a split brain scenario; i.e., the cluster is partitioned into smaller clusters of equal number of nodes, each of which behaving as it is the only active cluster.
By default all nodes are master-eligible, but if those nodes go under heavy load, it can overwhelm the ability of nodes to perform the master node responsibilities thereby causing problems for the cluster. For this reason, it is recommended to use dedicated master nodes; dedicated master nodes can be provisioned with fewer resources than data nodes because they only handle cluster state and not user data.
CAP Theorem
The theorem, proven by Eric Brewer, states that a distributed system can only have two of the following three properties: Consistency, Availability, and Partition-Tolerant (CAP). Since a distributed system will always suffer from occasional network partition, it can only be either consistent or available. Distributed systems are generally configured to favor availability over consistency; favoring availability over consistency means that when a client makes a request for information, it will always get an answer, but that answer may be stale.
The recommended minimum size of a quorum (majority) distributed system cluster is three (3) to provide fault tolerance in the case of failure.
| Servers | No. Required for Majority | Failure Tolerance |
|---|---|---|
| 1 | 1 | 0 |
| 2 | 2 | 0 |
| 3 | 2 | 1 |
| 4 | 3 | 1 |
| 5 | 3 | 2 |
| 6 | 4 | 2 |
| 7 | 4 | 3 |
Please note the following:
- If there is only one server, writes (data) will be lost in the event of failure.
- If there are two servers and one fails, the remaining server will be unable to reach a quorum; writes will be lost until the second server returns.
- If more servers are added, fault tolerance is improved; however, write performance is reduced since data need to be replicated to more servers.
- If the size of the cluster grows beyond seven (7), the probability of losing enough servers to not have a quorum is low enough that is not worth the performance trade-off.
- If a distributed system has more than seven (7) servers, five (5) or seven (7) servers can be used to form the cluster, and the remaining servers run clients that can query the system but do not take part in the quorum.
- Even numbers are generally best avoided since they increase the cluster size (decreasing performance) but do not improve failure tolerance.
Deploying the Master Nodes
Since this deployment will be using dedicated master nodes, persistent storage will be required thereby StatefulSets will be used for the master nodes. Furthermore, because dedicated master nodes do not process search and query requests nor hold any data, the node type that is chosen for this role typically does not require a large amount of CPU or RAM memory. A master node is eligible to be elected as the master node, which controls the cluster. This is the most critical type of node in your cluster; without having master nodes, you can’t have an elastic search cluster.
The excerpt below is from the file bootstrap.tf, and it defines the master nodes for your cluster. Let’s examine the code a bit closer; the code is color-coded for easier reading.
locals {
  namespace = kubernetes_namespace.ns.metadata[0].name
  ...
  #################
  # Elasticsearch #
  #################
  es_issuer = "es-selfsigned-issuer"
  es_secret_cert_name = "es-secret-cert"
  es_configmap = "es-config"
  es_service_account = "es-service-account"
  ...
  ####################
  # Name of Services #
  ####################
  ...
  svc_elasticsearch_headless = "mem-elasticsearch-headless"
  svc_elasticsearch_master = "mem-elasticsearch-master"
  svc_elasticsearch_data = "mem-elasticsearch-data"
  svc_elasticsearch_client = "mem-elasticsearch-client"
  ...
}
...
module "mem-elasticsearch-master" {
  count = var.k8s_manifest_crd ? 0 : 1
  source = "./modules/elk/elasticsearch/es-master"
  app_name = var.app_name
  image_tag = "docker.elastic.co/elasticsearch/elasticsearch:8.6.0"
  imagePullPolicy = "IfNotPresent"
  publish_not_ready_addresses = true
  namespace = local.namespace
  replicas = 3
  # The default is to deploy all pods serially. By setting this to parallel, all pods are started
  # at the same time when bootstrapping the cluster.
  pod_management_policy = "Parallel"
  # Limits and requests for CPU resources are measured in millicores. If the container needs one
  # full core to run, use the value '1000m.' If the container only needs 1/4 of a core, use the
  # value of '250m.'
  qos_limits_cpu = "1000m"
  qos_limits_memory = "2Gi"
  pvc_access_modes = ["ReadWriteOnce"]
  pvc_storage_size = "2Gi"
  pvc_storage_class_name = "ibmc-block-silver"
  env = {
    "node.roles": "[master]"
    ES_JAVA_OPTS: "-Xms1g -Xmx1g"
    "discovery.seed_hosts": <<EOL
      "${local.svc_elasticsearch_master}-0.${local.svc_elasticsearch_headless}.${local.namespace}.svc.cluster.local,
       ${local.svc_elasticsearch_master}-1.${local.svc_elasticsearch_headless}.${local.namespace}.svc.cluster.local,
       ${local.svc_elasticsearch_master}-2.${local.svc_elasticsearch_headless}.${local.namespace}.svc.cluster.local"
    EOL
    "cluster.initial_master_nodes": <<EOL
      "${local.svc_elasticsearch_master}-0,
       ${local.svc_elasticsearch_master}-1,
       ${local.svc_elasticsearch_master}-2"
    EOL
  }
  es_configmap = local.es_configmap
  es_service_account = local.es_service_account
  transport_service_port = 9300
  transport_service_target_port = 9300
  service_name_headless = local.svc_elasticsearch_headless
  service_name = local.svc_elasticsearch_master
}
For more configuration information, go to Important Elasticsearch Configuration.
node.roles – To define a node’s role, set the node.roles.
ES_JAVA_OPTS – Elasticsearch recommends that the value for the maximum and minimum heap size be identical; by default, Elasticsearch is configured to use a heap with a minimum and maximum size of 1GB. Furthermore, the JVM heap size is 1GB, by default. For more information, go here.
discovery.seed_hosts – To form a cluster with nodes on other hosts, use the static discovery.seed_hosts setting.
cluster.initial_master_nodes – The initial set of master-eligible nodes is defined in the cluster.initial_master_nodes setting. For more information, go here.
module mem-elasticsearch-master
The file to create the resources for deploying the masters is located here. The excerpts below are from this file and are color-coded for easier reading.
/***
-------------------------------------------------------
A Terraform reusable module for deploying microservices
-------------------------------------------------------
Define input variables to the module.
***/
...
# For more information, go here.
variable pod_management_policy {
  default = "OrderedReady"
  type = string
}
# The primary use case for setting this field is to use a StatefulSet's Headless Service to
# propagate SRV records for its Pods without respect to their readiness for purpose of peer
# discovery.
variable publish_not_ready_addresses {
  default = false
  type = bool
}
...

/***
Define local variables.
***/
locals {
  pod_selector_label = "ps-${var.service_name}"
  svc_label = "svc-${var.service_name_headless}"
  es_label = "es-cluster"
}

resource "null_resource" "scc-elasticsearch" {
  triggers = {
    always_run = timestamp()
  }
  provisioner "local-exec" {
    command = "oc apply -f ./modules/elk/elasticsearch/util/mem-elasticsearch-scc.yaml"
  }
  provisioner "local-exec" {
    when = destroy
    command = "oc delete scc mem-elasticsearch-scc"
  }
}

resource "kubernetes_config_map" "es_config" {
  metadata {
    name = var.es_configmap
    namespace = var.namespace
    labels = {
      app = var.app_name
    }
  }
  data = {
    # ================================ Elasticsearch Configuration ================================
    # ------------------------------------------ Cluster ------------------------------------------
    # Cluster name identifies the cluster for auto-discovery. If you're running multiple clusters
    # on the same network, make sure you use unique names.
    "cluster.name": "cluster-elk"
    # -------------------------------------------- Node -------------------------------------------
    # ------------------------------------------- Paths -------------------------------------------
    # Path to directory where to store the data (separate multiple locations by comma).
    "path.data": "/es-data/data/"
    # Path to log files.
    "path.logs": "/es-data/logs/"
    # Path to directory containing the configuration file (this file and logging.yml).
    # path.conf: /es-data/configs/
    # ------------------------------------------ Network ------------------------------------------
    # By default Elasticsearch listens for HTTP traffic on the first free port it finds starting at
    # 9200.
    "http.port": 9200
    # ----------------------------------------- Discovery -----------------------------------------
    # ------------------------------------------ Security -----------------------------------------
    # For more information about security, please visit the links below:
    # https://www.elastic.co/guide/en/elasticsearch/reference/8.5/configuring-stack-security.html
    # https://www.elastic.co/guide/en/elasticsearch/reference/8.5/security-basic-setup.html
    # https://www.elastic.co/guide/en/elasticsearch/reference/current/security-settings.html
    #
    # X-Pack settings.
    "xpack.license.self_generated.type": "basic"
    "xpack.security.enabled": false
    "xpack.security.transport.ssl.enabled": false
    "xpack.security.transport.ssl.verification_mode": "none"
    "xpack.security.http.ssl.enabled": false
    "xpack.monitoring.collection.enabled": true
    # Disable unused xpack features.
    # xpack.monitoring.enabled: false  # Deprecated in 7.8.0.
    "xpack.graph.enabled": false
    # You configure Watcher settings to set up Watcher and send notifications via email, Slack, and
    # PagerDuty.
    # https://www.elastic.co/guide/en/elasticsearch/reference/current/notification-settings.html
    "xpack.watcher.enabled": false
    # https://www.elastic.co/guide/en/elasticsearch/reference/current/ml-settings.html
    "xpack.ml.enabled": false
  }
}

resource "kubernetes_service_account" "service_account" {
  metadata {
    name = "${var.service_name}-service-account"
    namespace = var.namespace
    labels = {
      app = var.app_name
    }
  }
}

resource "kubernetes_role" "role" {
  metadata {
    name = "es-role"
    namespace = var.namespace
    labels = {
      app = var.app_name
    }
  }
  rule {
    # Resources in the core apiGroup, which has no name - hence the "".
    api_groups = [""]
    verbs = ["get", "watch", "list"]
    # The plural form must be used when specifying resources.
    resources = ["endpoints", "services", "namespaces"]
  }
  rule {
    api_groups = ["security.openshift.io"]
    verbs = ["use"]
    resources = ["securitycontextconstraints"]
    resource_names = ["mem-elasticsearch-scc"]
  }
}

resource "kubernetes_role_binding" "role_binding" {
  metadata {
    name = "es-role-binding"
    namespace = var.namespace
    labels = {
      app = var.app_name
    }
  }
  # A RoleBinding always references a single Role, but it can bind the Role to multiple subjects.
  role_ref {
    api_group = "rbac.authorization.k8s.io"
    kind = "Role"
    # This RoleBinding references the Role specified below...
    name = kubernetes_role.role.metadata[0].name
  }
  # ... and binds it to the specified ServiceAccount in the specified namespace.
  subject {
    # The default permissions for a ServiceAccount don't allow it to list or modify any resources.
    kind = "ServiceAccount"
    name = kubernetes_service_account.service_account.metadata[0].name
    namespace = kubernetes_service_account.service_account.metadata[0].namespace
  }
}

resource "kubernetes_stateful_set" "stateful_set" {
  metadata {
    ...
  }
  #
  spec {
    replicas = var.replicas
    service_name = var.service_name_headless
    pod_management_policy = var.pod_management_policy
    revision_history_limit = var.revision_history_limit
    # Pod Selector - You must set the .spec.selector field of a StatefulSet to match the labels of
    # its .spec.template.metadata.labels. Failing to specify a matching Pod Selector will result in
    # a validation error during StatefulSet creation.
    selector {
      match_labels = {
        # It must match the labels in the Pod template (.spec.template.metadata.labels).
        pod_selector_lbl = local.pod_selector_label
      }
    }
    # updateStrategy:
    #   type: RollingUpdate
    #
    # The Pod template.
    template {
      metadata {
        # Labels attach to the Pod.
        labels = {
          app = var.app_name
          # It must match the label for the pod selector (.spec.selector.matchLabels).
          pod_selector_lbl = local.pod_selector_label
          # It must match the label selector of the Service.
          svc_selector_lbl = local.svc_selector_label
          es_lbl = local.es_label
          es_role_lbl = "es-master"
        }
      }
      #
      spec {
        service_account_name = kubernetes_service_account.service_account.metadata[0].name
        affinity {
          pod_anti_affinity {
            required_during_scheduling_ignored_during_execution {
              label_selector {
                match_expressions {
                  key = "es_lbl"
                  operator = "In"
                  values = ["${local.es_label}"]
                }
              }
              topology_key = "kubernetes.io/hostname"
            }
          }
        }
        termination_grace_period_seconds = var.termination_grace_period_seconds
        init_container {
          name = "init-commands"
          image = "busybox:1.34.1"
          image_pull_policy = "IfNotPresent"
          command = [
            "/bin/sh",
            "-c",
            "chown -R 1000:1000 /es-data; sysctl -w vm.max_map_count=262144"
          ]
          security_context {
            run_as_non_root = false
            run_as_user = 0
            run_as_group = 0
            read_only_root_filesystem = true
            privileged = true
          }
          volume_mount {
            name = "es-storage"
            mount_path = "/es-data"
          }
        }
        container {
          name = var.service_name
          image = var.image_tag
          image_pull_policy = var.imagePullPolicy
          security_context {
            capabilities {
              drop = ["ALL"]
            }
            run_as_non_root = true
            run_as_user = 1000
            run_as_group = 1000
            read_only_root_filesystem = false
            privileged = false
          }
          ...
          # A human-readable identifier for a particular instance of Elasticsearch.
          env {
            name = "node.name"
            value_from {
              field_ref {
                field_path = "metadata.name"
              }
            }
          }
          # By default, Elasticsearch only binds to loopback addresses such as 127.0.0.1 and [::1].
          env {
            name = "network.host"
            value_from {
              field_ref {
                field_path = "status.podIP"
              }
            }
          }
          env_from {
            config_map_ref {
              # All key-value pairs of the ConfigMap are referenced.
              name = kubernetes_config_map.es_config.metadata[0].name
            }
          }
          ...
          volume_mount {
            name = "es-storage"
            mount_path = "/es-data"
          }
        }
      }
    }
    # This template will be used to create a PersistentVolumeClaim for each pod.
    # Since PersistentVolumes are cluster-level resources, they do not belong to any namespace, but
    # PersistentVolumeClaims can only be created in a specific namespace; they can only be used by
    # pods in the same namespace.
    volume_claim_template {
      metadata {
        name = "es-storage"
        namespace = var.namespace
        labels = {
          app = var.app_name
        }
      }
      spec {
        access_modes = var.pvc_access_modes
        storage_class_name = var.pvc_storage_class_name
        resources {
          requests = {
            storage = var.pvc_storage_size
          }
        }
      }
    }
  }
}

# Before deploying a StatefulSet, you will need to create a headless Service, which will be used
# to provide the network identity for your stateful pods.
resource "kubernetes_service" "headless_service" {  # For inter-node communication.
  metadata {
    name = var.service_name_headless
    namespace = var.namespace
    labels = {
      app = var.app_name
    }
  }
  spec {
    selector = {
      # All pods with the svc_selector_lbl=local.svc_selector_label label belong to this service.
      svc_selector_lbl = local.svc_selector_label
    }
    session_affinity = var.service_session_affinity
    port {
      name = "transport"  # Inter-node communication.
      port = var.transport_service_port
      target_port = var.transport_service_target_port
      protocol = "TCP"
    }
    type = var.service_type
    cluster_ip = "None"  # Headless Service.
    publish_not_ready_addresses = var.publish_not_ready_addresses
  }
}
scc-elasticsearch – The file mem-elasticsearch-scc.yaml contains the security context constraints (see OpenShift’s Security Context Constraints). This resource is used by the master and data pods; hence, the module mem-elasticsearch-data has a dependency on this module. (Note: In order to apply/delete the custom SCC, you need to be logged in to your cluster by using the oc login command; otherwise, these commands will fail. For more information, see null_resource.)
service account, role, and role binding – A Role is created with a rule to use the security context constraints. The Role defines the actions that can be performed without specifying who can perform them. To specify who can perform the actions, the Role must be bound to one or more subjects. Binding a Role to a subject (ServiceAccount) is achieved by creating a RoleBinding resource. Finally, the ServiceAccount is assigned to a pod. For more information, see module “traefik”.
stateful_set – A StatefulSet ensures the retention of the identity and state of pods (pods can crash, be rescheduled, or evicted). That is to say, when a stateful pod crashes (or the node it is running on fails), the pod will be rescheduled on a node, but the new instance will keep the same name, network identity, and state as the one it is replacing. These pods are not exact replicas of each other.
service_name – The name of the service that governs this StatefulSet. The service provides the actual network identity to each pod; i.e., each pod gets its own DNS entry allowing its peers and other clients in the cluster to address the pod by its hostname. The DNS entry follows the pattern: pod-name.service-name.namespace.svc.cluster.local.
service_account_name – Assign the service account created earlier to the pod and, by extension, the security context constraints.
affinity/pod_anti_affinity – An anti-affinity rule instructs the scheduler not to place a new pod on nodes where pods matching the podAntiAffinity’s label selector (es_lbl=es-cluster) are running. That is, you want the master, data, and client instances running on different nodes. For this deployment, the cluster requires at least seven (7) nodes – three (3) masters, two (2) data, and two (2) clients.
init_container – The init container executes the following two commands:
(1) The permissions on the volume. The container runs Elasticsearch as user elasticsearch using 1000:1000 (uid:gid). Bind mounted host directories and files need to be accessible by this user.
(2) The vm.max_map_count kernel setting must be set to at least 262144 for production use.
To view the current value of the vm.max_map_count setting, select the pod where you want to execute the command:
$ kubectl exec mem-elasticsearch-data-0 -n memories -- sysctl vm.max_map_countcontainer/security_context – The security context for this container is as follows:
All capabilities are dropped.
Container will run as non-root.
uid:gid is set to 1000/1000.
Root filesystem is writable.
Container will not run as privilege.
node.name – A human-readable identifier for a particular instance of Elasticsearch.
network.host – By default, Elasticsearch only binds to loopback addresses such as 127.0.0.1 and [::1].
env_from – Elasticsearch configuration values.
headless_service – Unlike stateless pods, stateful pods sometimes need to be addressable by their hostname. For this reason, a StatefulSet requires a corresponding governing headless Service that’s used to provide the actual network identity to each pod. Through this Service, each pod gets its own DNS entry thereby allowing its peers in the cluster to address the pod by its hostname. For example, if the governing Service belongs to the default namespace and is called service1, and the pod name is pod-0, the pod can be reached by its fully qualified domain name of pod-0.service1.default.svc.cluster.local.
To make the service headless, set the clusterIP field in the service spec to None. Kubernetes will not assign the service a cluster IP through which clients could connect to the pods backing the service; instead, each pod gets its own IP address. Nonetheless, a headless service provides load balancing across pods via the DNS round-robin mechanism instead of via the service proxy.
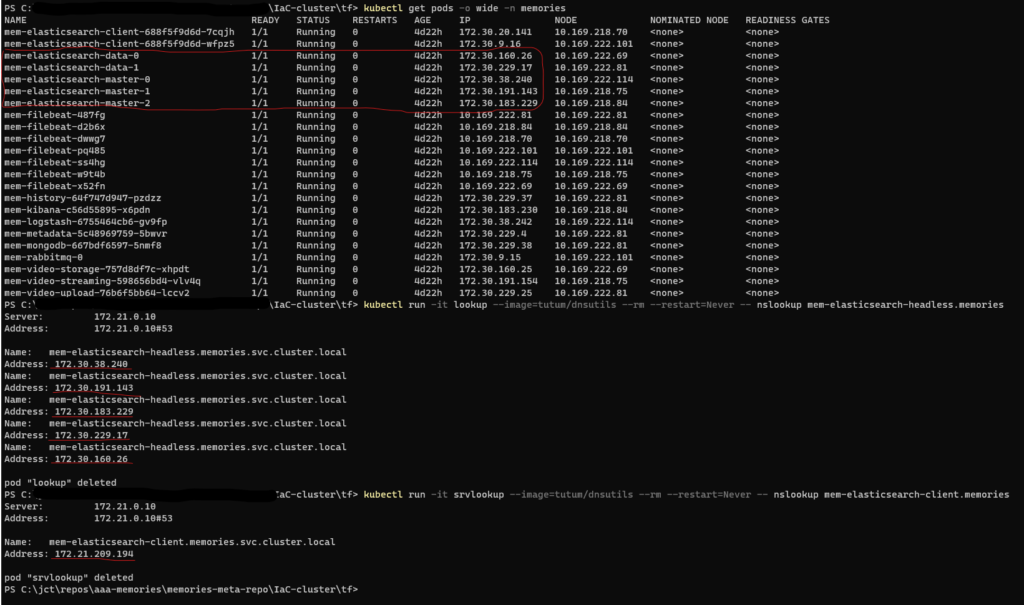
To list the SRV records for the stateful pods, perform a DNS lookup from inside a pod running in the cluster. By default, only the pods that are ready to become endpoints of services are returned. If you want to use the service discovery mechanism to find all pods matching the service’s label selector, you must instruct Kubernetes to return all pods added to a service, regardless of the pod’s readiness status, with the field publishNotReadyAddresses set to true.
$ kubectl run -it srvlookup --image=tutum/dnsutils --rm --restart=Never -- dig SRV <service-name>.<namespace>.svc.cluster.local
$ kubectl run -it lookup --image=tutum/dnsutils --rm --restart=Never -- nslookup <service-name>.<namespace>.svc.cluster.local
# For this implementation:
$ kubectl run -it srvlookup --image=tutum/dnsutils --rm --restart=Never -- dig SRV mem-elasticsearch-headless.memories.svc.cluster.local
#
# To compare and confirm, run these commands (see Figure 1 below):
$ kubectl get pods -o wide -n memories
# Headless service.
$ kubectl run -it lookup --image=tutum/dnsutils --rm --restart=Never -- nslookup mem-elasticsearch-headless.memories.svc.cluster.local
# Non-headless service.
$ kubectl run -it lookup --image=tutum/dnsutils --rm --restart=Never -- nslookup mem-elasticsearch-client.memories
Note: I am using the tutum/dnsutils container image, which is available on Docker Hub, and contains the binaries for nslookup and dig; this container can be used to perform DNS-related actions. I am running a one-off pod called srvlookup or lookup, attached to the console, and deleted as soon as it terminates. When I run dig, I am listing the SRV records for the stateful pods. SRV records are used to point to hostnames and ports of servers providing a specific service; Kubernetes creates SRV records to point to the hostnames of the pods backing a headless service.
Data Nodes
A data node holds data and performs data related operations such as CRUD (Create, Read, Update, and Delete), indexing, searching, and aggregations. In an Elasticsearch cluster, data nodes are responsible for doing the heavy lifting, and, therefore, these nodes consume the most CPU cycles and memory than any other type of node in the cluster.
Deploying the Data Nodes
Since this deployment will be using dedicated data nodes, persistent storage will be required thereby StatefulSets will be used for these nodes. Furthermore, because data nodes do most of the work, the node type that is chosen for this role requires a larger amount of CPU and RAM memory.
The excerpt below is from the file bootstrap.tf, and it defines the data nodes for your cluster. Let’s examine the code; the code is color-coded for easier reading.
module "mem-elasticsearch-data" {
  count = var.k8s_manifest_crd ? 0 : 1
  depends_on = [
    module.mem-elasticsearch-master
  ]
  source = "./modules/elk/elasticsearch/es-data"
  app_name = var.app_name
  image_tag = "docker.elastic.co/elasticsearch/elasticsearch:8.6.0"
  image_pull_policy = "IfNotPresent"
  publish_not_ready_addresses = true
  namespace = local.namespace
  replicas = 2
  pod_management_policy = "Parallel"
  qos_limits_cpu = "3000m"
  qos_limits_memory = "8Gi"
  pvc_access_modes = ["ReadWriteOnce"]
  pvc_storage_size = "50Gi"
  pvc_storage_class_name = "ibmc-block-silver"
  env = {
    "node.roles": "[data]"
    ES_JAVA_OPTS: "-Xms4g -Xmx4g"
    "discovery.seed_hosts": <<EOL
      "${local.svc_elasticsearch_master}-0.${local.svc_elasticsearch_headless}.${local.namespace}.svc.cluster.local,
       ${local.svc_elasticsearch_master}-1.${local.svc_elasticsearch_headless}.${local.namespace}.svc.cluster.local,
       ${local.svc_elasticsearch_master}-2.${local.svc_elasticsearch_headless}.${local.namespace}.svc.cluster.local"
    EOL
    "cluster.initial_master_nodes": <<EOL
      "${local.svc_elasticsearch_master}-0,
       ${local.svc_elasticsearch_master}-1,
       ${local.svc_elasticsearch_master}-2"
    EOL
  }
  es_configmap = local.es_configmap
  es_service_account = local.es_service_account
  transport_service_port = 9300
  transport_service_target_port = 9300
  service_name_headless = local.svc_elasticsearch_headless
  service_name = local.svc_elasticsearch_data
}
depends_on – This module depends on the mem-elasticsearch-master module for the following resources: config map, service account, and headless service.
qos – The CPU and memory requests for the data nodes.
node.roles – To define a node’s role, set the node.roles.
module mem-elasticsearch-data
The file to create the resources for deploying the data nodes is located here. The excerpts below are from this file and are color-coded for easier reading.
...

resource "kubernetes_stateful_set" "stateful_set" {
  metadata {
  ...
  }
  #
  spec {
    replicas = var.replicas
    service_name = var.service_name_headless
    pod_management_policy = var.pod_management_policy
    revision_history_limit = var.revision_history_limit
    # Pod Selector - You must set the .spec.selector field of a StatefulSet to match the labels of
    # its .spec.template.metadata.labels. Failing to specify a matching Pod Selector will result in
    # a validation error during StatefulSet creation.
    selector {
      match_labels = {
        # It must match the labels in the Pod template (.spec.template.metadata.labels).
        pod_selector_lbl = local.pod_selector_label
      }
    }
    # The Pod template.
    template {
      metadata {
        # Labels attach to the Pod.
        labels = {
          app = var.app_name
          # It must match the label for the pod selector (.spec.selector.matchLabels).
          pod_selector_lbl = local.pod_selector_label
          # It must match the label selector of the Service.
          svc_selector_lbl = local.svc_selector_label
          es_lbl = local.es_label
          es_role_lbl = "es-data"
        }
      }
      #
      spec {
        service_account_name = var.es_service_account
        affinity {
          pod_anti_affinity {
            required_during_scheduling_ignored_during_execution {
              label_selector {
                match_expressions {
                  key = "es_lbl"
                  operator = "In"
                  values = ["${local.es_label}"]
                }
              }
              topology_key = "kubernetes.io/hostname"
            }
          }
        }
        termination_grace_period_seconds = var.termination_grace_period_seconds
        init_container {
          name = "init-commands"
          image = "busybox:1.34.1"
          image_pull_policy = "IfNotPresent"
          command = [
            "/bin/sh",
            "-c",
            # Fix the permissions on the volume.
            # Increase the default vm.max_map_count to 262144.
            # Increase the max number of open file descriptors.
            "chown -R 1000:1000 /es-data; sysctl -w vm.max_map_count=262144; ulimit -n 65536"
          ]
          security_context {
            run_as_non_root = false
            run_as_user = 0
            run_as_group = 0
            read_only_root_filesystem = true
            privileged = true
          }
          volume_mount {
            name = "es-storage"
            mount_path = "/es-data"
          }
        }
        container {
          name = var.service_name
          image = var.image_tag
          image_pull_policy = var.image_pull_policy
          security_context {
            capabilities {
              drop = ["ALL"]
            }
            run_as_non_root = true
            run_as_user = 1000
            run_as_group = 1000
            read_only_root_filesystem = false
            privileged = false
          }
          ...
          env {
            name = "node.name"
            value_from {
              field_ref {
                field_path = "metadata.name"
              }
            }
          }
          env {
            name = "network.host"
            value_from {
              field_ref {
                field_path = "status.podIP"
              }
            }
          }
          env_from {
            config_map_ref {
              # All key-value pairs of the ConfigMap are referenced.
              name = var.es_configmap
            }
          }
          ...
          volume_mount {
            name = "es-storage"
            mount_path = "/es-data"
          }
        }
      }
    }
    volume_claim_template {
      metadata {
        name = "es-storage"
        namespace = var.namespace
        labels = {
          app = var.app_name
        }
      }
      spec {
        access_modes = var.pvc_access_modes
        storage_class_name = var.pvc_storage_class_name
        resources {
          requests = {
            storage = var.pvc_storage_size
          }
        }
      }
    }
  }
}
var.es_configmap, var.es_service_account, var.service_name_headless – These resources were created in the file for the master nodes.
Since this file is almost identical to the file for the master nodes, please reference the master nodes file for more information.
Client/Coordinating Nodes
Client nodes were removed from Elasticsearch after version 2.4 and were replaced by coordinating nodes. Client nodes route requests, handle the search reduce phase, and distribute bulk indexing. Consumers of Elasticsearch clusters interact with the these nodes; they essentially act as smart load balancers. Client nodes help reduce the load on individual data and master nodes, which makes a difference in large clusters. If they are not deployed, data nodes will serve as client nodes; many clusters do not use dedicated coordinating or ingest nodes thereby leaving the ingest and coordination functions to the data nodes.
Deploying the Client Nodes
Because client nodes are stateless (do not require persistent storage), you can deploy them as Kubernetes Deployments. The Kubernetes LoadBalancer Service will be used to forward incoming traffic to the client nodes. The data and master nodes, on the other hand, require persistent storage, and they are deployed in Kubernetes as StatefulSets.
The excerpt below is from the file bootstrap.tf, and it defines the client nodes for your cluster. Let’s examine the code; the code is color-coded for easier reading.
module "mem-elasticsearch-client" {
  count = var.k8s_manifest_crd ? 0 : 1
  depends_on = [
    module.mem-elasticsearch-data
  ]
  source = "./modules/elk/elasticsearch/es-client"
  app_name = var.app_name
  image_tag = "docker.elastic.co/elasticsearch/elasticsearch:8.6.0"
  image_pull_policy = "IfNotPresent"
  namespace = local.namespace
  replicas = 2
  qos_limits_cpu = "1000m"
  qos_limits_memory = "4Gi"
  env = {
    "node.roles": "[remote_cluster_client]"  # A coordinating node.
    ES_JAVA_OPTS: "-Xms2g -Xmx2g"
    "discovery.seed_hosts": <<EOL
      "${local.svc_elasticsearch_master}-0.${local.svc_elasticsearch_headless}.${local.namespace}.svc.cluster.local,
       ${local.svc_elasticsearch_master}-1.${local.svc_elasticsearch_headless}.${local.namespace}.svc.cluster.local,
       ${local.svc_elasticsearch_master}-2.${local.svc_elasticsearch_headless}.${local.namespace}.svc.cluster.local"
    EOL
  }
  es_configmap = local.es_configmap
  # Port 9200 for the HTTP API.
  http_service_port = 9200
  http_service_target_port = 9200
  # Port 9300 to communicate with the other nodes of the cluster.
  transport_service_port = 9300
  transport_service_target_port = 9300
  service_name = local.svc_elasticsearch_client
}
depends_on – This module depends on the mem-elasticsearch-data module, and, furthermore, it also depends on the mem-elasticsearch-master module for the following resource: config map.
node.roles – To define a node’s role, set the node.roles.
mem-elasticsearch-client
The file to create the resources for deploying the clients nodes is located here. The excerpts below are from this file and are color-coded for easier reading.
...
resource "kubernetes_deployment" "deployment" {
  metadata {
  ...
  }
  #
  spec {
    replicas = var.replicas
    revision_history_limit = var.revision_history_limit
    # The label selector determines the pods the ReplicaSet manages.
    selector {
    ...
    }
    # The Pod template.
    template {
      metadata {
        # Labels attach to the Pod.
        # The pod-template-hash label is added by the Deployment controller to every ReplicaSet
        # that a Deployment creates or adopts.
        labels = {
          app = var.app_name
          # It must match the label selector of the ReplicaSet.
          pod_selector_lbl = local.pod_selector_label
          # It must match the label selector of the Service.
          svc_selector_lbl = local.svc_selector_label
          es_lbl = local.es_label
          es_role_lbl = "es-client"
        }
      }
      # The Pod template's specification.
      spec {
        affinity {
          pod_anti_affinity {
            required_during_scheduling_ignored_during_execution {
              label_selector {
                match_expressions {
                  key = "es_lbl"
                  operator = "In"
                  values = ["${local.es_label}"]
                }
              }
              topology_key = "kubernetes.io/hostname"
            }
          }
        }
        termination_grace_period_seconds = var.termination_grace_period_seconds
        container {
          name = var.service_name
          image = var.image_tag
          image_pull_policy = var.image_pull_policy
          security_context {
            capabilities {
              drop = ["ALL"]
            }
            run_as_non_root = true
            run_as_user = 1000
            run_as_group = 1000
            read_only_root_filesystem = false
            privileged = false
          }
          ...
          env {
            name = "node.name"
            value_from {
              field_ref {
                field_path = "metadata.name"
              }
            }
          }
          env {
            name = "network.host"
            value_from {
              field_ref {
                field_path = "status.podIP"
              }
            }
          }
          env_from {
            config_map_ref {
              # All key-value pairs of the ConfigMap are referenced.
              name = var.es_configmap
            }
          }
          ...
          volume_mount {
            name = "es-storage"
            mount_path = "/es-data"
          }
        }
        volume {
          name = "es-storage"
          empty_dir {
          }
        }
      }
    }
  }
}

# Declare a K8s service to create a DNS record to make the microservice accessible within the
# cluster.
resource "kubernetes_service" "service" {
  metadata {
  ...
  }
  #
  spec {
    # The label selector determines which pods belong to the service.
    selector = {
      svc_selector_lbl = local.svc_selector_label
    }
    session_affinity = var.service_session_affinity
    port {
      name = "http"
      port = var.http_service_port  # Service port.
      target_port = var.http_service_target_port  # Pod port.
      protocol = "TCP"
    }
    port {
      name = "transport"
      port = var.transport_service_port  # Service port.
      target_port = var.transport_service_target_port  # Pod port.
      protocol = "TCP"
    }
    type = var.service_type
  }
}
affinity/pod_anti_affinity – An anti-affinity rule instructs the scheduler not to place a new pod on nodes where pods matching the podAntiAffinity’s label selector (es_lbl=es-cluster) are running. That is, you want the master, data, and client instances running on different nodes. For this deployment, the cluster requires at least seven (7) nodes – three (3) masters, two (2) data, and two (2) clients.
var.es_configmap – This resource was created in the file for the master nodes.
Check Elasticsearch Cluster Status
The following is a brief introduction to some useful commands for checking the Elasticsearch cluster health status.
To check that kubectl is configured to communicate with your Kubernetes cluster.
PS C:\...\IaC-cluster\tf> kubectl get nodes
NAME            STATUS   ROLES           AGE   VERSION
10.169.218.95   Ready    master,worker   21h   v1.21.11+31d53a1
...
10.169.222.76   Ready    master,worker   21h   v1.21.11+31d53a1

To verify that the StatefulSets were created successfully.
PS C:\...\IaC-cluster\tf> kubectl get sts -n memories
NAME                       READY   AGE
mem-elasticsearch-data     2/2     155m
mem-elasticsearch-master   3/3     162m

To display the pods running in the cluster.
PS C:\...\IaC-cluster\tf> kubectl get pods -n memories
NAME                                        READY   STATUS    RESTARTS   AGE
mem-elasticsearch-client-6ccb7f58c7-ld2nf   1/1     Running   0          9h
mem-elasticsearch-client-6ccb7f58c7-zwppc   1/1     Running   0          9h
mem-elasticsearch-data-0                    1/1     Running   0          9h
mem-elasticsearch-data-1                    1/1     Running   0          9h
mem-elasticsearch-master-0                  1/1     Running   0          9h
mem-elasticsearch-master-1                  1/1     Running   0          9h
mem-elasticsearch-master-2                  1/1     Running   0          9h
mem-kibana-769f96b77b-mwntv                 1/1     Running   0          9h

PS C:\...\IaC-cluster\tf> kubectl get pods -n memories -o wide
NAME                                        READY   STATUS    RESTARTS   AGE   IP               NODE            NOMINATED NODE   READINESS GATES
mem-elasticsearch-client-6ccb7f58c7-ld2nf   1/1     Running   0          35h   172.30.248.85    10.169.222.74   <none>           <none>
mem-elasticsearch-client-6ccb7f58c7-zwppc   1/1     Running   0          35h   172.30.253.148   10.169.222.60   <none>           <none>
mem-elasticsearch-data-0                    1/1     Running   0          36h   172.30.248.84    10.169.222.74   <none>           <none>
mem-elasticsearch-data-1                    1/1     Running   0          35h   172.30.206.35    10.169.222.70   <none>           <none>
mem-elasticsearch-master-0                  1/1     Running   0          36h   172.30.253.147   10.169.222.60   <none>           <none>
mem-elasticsearch-master-1                  1/1     Running   0          36h   172.30.206.34    10.169.222.70   <none>           <none>
mem-elasticsearch-master-2                  1/1     Running   0          36h   172.30.248.83    10.169.222.74   <none>           <none>
mem-kibana-769f96b77b-mwntv                 1/1     Running   0          36h   172.30.92.63     10.169.222.72   <none>           <none>

To display only the Elasticsearch pods running in the cluster.
PS C:\...\IaC-cluster\tf> kubectl get pods -n memories -l es_lbl=es-cluster
PS C:\...\IaC-cluster\tf> kubectl get pods -n memories -l es_lbl=es-cluster -o wide

Note: At the moment, the Elasticsearch Docker image contains the curl command-line tool. This tool is a common source of security problems, and the removal of the tool from the image has been proposed. An alternative to the curl command-line tool is the wget command, which the busybox image contains. With both the curl and wget commands, the URL that is used with the http:// protocol requires one of the services running in the Elasticsearch cluster; for this deployment, the services are mem-elasticsearch-headless (master and data) and mem-elasticsearch-client (client). The usage of the wget command is shown below.
$ kubectl run -it elasticsearch --image=busybox:latest --rm --restart=Never -- wget -O /dev/stdout "http://<a-service-running-in-the-elasticsearch-cluster>:9200/..."

The usage of the curl command is shown below.
$ kubectl exec <a-pod-running-in-the-cluster> -n memories -- curl -s -XGET "http://<a-service-running-in-the-elasticsearch-cluster>:9200/..."

Cluster health
In the JSON response, search for the field status. If its value is green, the cluster is ready.
PS C:\...\IaC-cluster\tf> kubectl exec mem-elasticsearch-data-0 -n memories -- curl -s -XGET "http://mem-elasticsearch-headless.memories:9200/_cluster/health?pretty"

Index level.
PS C:\...\IaC-cluster\tf> kubectl run -it elasticsearch --image=busybox --rm --restart=Never -- wget -O /dev/stdout "http://mem-elasticsearch-client.memories:9200/_cluster/health?level=indices&pretty"

Shard level.
PS C:\...\IaC-cluster\tf> kubectl exec mem-elasticsearch-data-0 -n memories -- curl -s -XGET "http://mem-elasticsearch-headless.memories:9200/_cluster/health?level=shards&pretty"

Nodes overview.
PS C:\...\IaC-cluster\tf> kubectl run -it elasticsearch --image=busybox --rm --restart=Never -- wget -O /dev/stdout "http://mem-elasticsearch-client.memories:9200/_cat/nodes?v"
Connecting to mem-elasticsearch-client.memories:9200 (172.21.189.103:9200)
saving to '/dev/stdout'
ip             heap.percent ram.percent cpu load_1m load_5m load_15m node.role master name
172.30.248.84             4          35   0    0.52    0.47     0.34 d         -      mem-elasticsearch-data-0
172.30.253.148           37          59   0    0.03    0.03     0.05 -         -      mem-elasticsearch-client-6ccb7f58c7-zwppc
172.30.206.34            50          83   0    0.29    0.27     0.31 m         *      mem-elasticsearch-master-1
172.30.206.35            42          35   0    0.29    0.27     0.31 d         -      mem-elasticsearch-data-1
172.30.248.85             7          59   0    0.52    0.47     0.34 -         -      mem-elasticsearch-client-6ccb7f58c7-ld2nf
172.30.248.83            64          80   0    0.52    0.47     0.34 m         -      mem-elasticsearch-master-2
172.30.253.147           40          81   0    0.03    0.03     0.05 m         -      mem-elasticsearch-master-0
stdout               100% |********************************|   908  0:00:00 ETA
'/dev/stdout' saved
pod "elasticsearch" deleted

Who is master.
PS C:\...\IaC-cluster\tf> kubectl exec mem-elasticsearch-data-0 -n memories -- curl -s -XGET "http://mem-elasticsearch-headless.memories:9200/_cat/master?v"
Defaulted container "mem-elasticsearch-data" out of: mem-elasticsearch-data, fix-permissions (init), init-sysctl (init), increase-fd (init)
id                     host          ip            node
qJAYwmbuQtSg8ib4s8ovIg 172.30.206.34 172.30.206.34 mem-elasticsearch-master-1

To see detail information regarding the election of the master node as well as the addition of data and client nodes, display the log of any of the master pods. To format the output, go to JSONLint. The -f flag is optional.
Linux
$ kubectl logs [-f] mem-elasticsearch-master-0 -n memories | grep ClusterApplierService

Windows CMD
C:\> kubectl logs [-f] mem-elasticsearch-master-0 -n memories | findstr "ClusterApplierService"

Windows PowerShell
PS C:\> kubectl logs [-f] mem-elasticsearch-master-0 -n memories | Select-String "ClusterApplierService"
{
  "@timestamp":"2022-10-25T15:28:33.545Z",
  "log.level":"INFO",
  "message":"master node changed {previous [], current
[{mem-elasticsearch-master-1}{qJAYwmbuQtSg8ib4s8ovIg}{6AyyZEZuTPGP57RfSli0TQ}{mem-elasticsearch-master-1}{172.30.206.34}{172.30.206.34:9300}{m}]}, added
{{mem-elasticsearch-master-1}{qJAYwmbuQtSg8ib4s8ovIg}{6AyyZEZuTPGP57RfSli0TQ}{mem-elasticsearch-master-1}{172.30.206.34}{172.30.206.34:9300}{m}}, term: 1,
version: 1, reason: ApplyCommitRequest{term=1, version=1, sourceNode={mem-elasticsearch-master-1}{qJAYwmbuQtSg8ib4s8ovIg}{6AyyZEZuTPGP57RfSli0TQ}{mem-elasticsearc
h-master-1}{172.30.206.34}{172.30.206.34:9300}{m}{xpack.installed=true}}",
  "ecs.version":"1.2.0",
  "service.name":"ES_ECS",
  "event.dataset":"elasticsearch.server",
  "process.thread.name":"elasticsearch[mem-elasticsearch-master-0][clusterApplierService#updateTask][T#1]",
  "log.logger":"org.elasticsearch.cluster.service.ClusterApplierService",
  "elasticsearch.node.name":"mem-elasticsearch-master-0",
  "elasticsearch.cluster.name":"cluster-elk"
}{
...
}{
  "@timestamp":"2022-10-25T15:30:59.995Z",
  "log.level":"INFO",
  "message":"added
{{mem-elasticsearch-master-2}{y-fuuEU-Sl6aXY50LmtfNg}{mmck_oKLQ7qzHJ-krbunSA}{mem-elasticsearch-master-2}{172.30.248.83}{172.30.248.83:9300}{m}}, term: 1,
version: 22, reason: ApplyCommitRequest{term=1, version=22, sourceNode={mem-elasticsearch-master-1}{qJAYwmbuQtSg8ib4s8ovIg}{6AyyZEZuTPGP57RfSli0TQ}{mem-elasticsearch-master-1}{172.30.206.34}{172.30.206.34:9300}{m}{xpack.installed=true}}",
  "ecs.version":"1.2.0",
  "service.name":"ES_ECS",
  "event.dataset":"elasticsearch.server",
  "process.thread.name":"elasticsearch[mem-elasticsearch-master-0][clusterApplierService#updateTask][T#1]",
  "log.logger":"org.elasticsearch.cluster.service.ClusterApplierService",
  "elasticsearch.cluster.uuid":"eg_Qb3yaS9WYY3SWqNKAFA",
  "elasticsearch.node.id":"X1S1qMd1RriLsKrf4uyAAQ",
  "elasticsearch.node.name":"mem-elasticsearch-master-0",
  "elasticsearch.cluster.name":"cluster-elk"
}{
  "@timestamp":"2022-10-25T15:32:14.192Z",
  "log.level":"INFO",
  "message":"added
{{mem-elasticsearch-data-0}{-dIc01jvRrub2NipKttQow}{udk0QlPJT_-VKiZlpWqE4A}{mem-elasticsearch-data-0}{172.30.248.84}{172.30.248.84:9300}{d}}, term: 1, version:
24, reason: ApplyCommitRequest{term=1, version=24, sourceNode={mem-elasticsearch-master-1}{qJAYwmbuQtSg8ib4s8ovIg}{6AyyZEZuTPGP57RfSli0TQ}{mem-elasticsearch-maste
r-1}{172.30.206.34}{172.30.206.34:9300}{m}{xpack.installed=true}}",
  "ecs.version":"1.2.0",
  "service.name":"ES_ECS",
  "event.dataset":"elasticsearch.server",
  "process.thread.name":"elasticsearch[mem-elasticsearch-master-0][clusterApplierService#updateTask][T#1]",
  "log.logger":"org.elasticsearch.cluster.service.ClusterApplierService",
  "elasticsearch.cluster.uuid":"eg_Qb3yaS9WYY3SWqNKAFA",
  "elasticsearch.node.id":"X1S1qMd1RriLsKrf4uyAAQ",
  "elasticsearch.node.name":"mem-elasticsearch-master-0",
  "elasticsearch.cluster.name":"cluster-elk"
}{
...
}{
...
}{
...
}
Logstash
Logstash is a log aggregator that collects data from various input sources, executes different transformations and enhancements, and then ships the data to various supported output destinations. The Logstash event processing pipeline has three stages: inputs, filters, and outputs. Inputs generate events, filters modify them, and outputs ship them elsewhere. Inputs and outputs support codecs that enable encoding and decoding of the data as it enters or exits the pipeline without having to use a separate filter. A brief description of the three stages follows:
- Inputs get data into Logstash. Some of the more commonly-used inputs are: file, syslog, redis, and beats.
- Filters are intermediary processing devices in the Logstash pipeline. Some useful filters include: grok, mutate, drop, and clone.
- Outputs are the final phase of the Logstash pipeline. Some commonly used outputs include: elasticsearch, file, graphite, and statsd.
The file to create the resources for deploying Logstash is located here; the excerpt below is from this file.
...
resource "kubernetes_config_map" "config" {
  metadata {
    name = "${var.service_name}-config"
    namespace = var.namespace
    labels = {
      app = var.app_name
    }
  }
  data = {
    # Settings and configuration options for Logstash are defined in the logstash.yml configuration
    # file. A full list of supported settings can be found in the reference guide.
    "logstash.yml" = <<EOF
      http:
        # Define the network address on which Logstash will listen; 0.0.0.0 denotes that it needs
        # to listen on all available interfaces.
        host: "0.0.0.0"
      path:
        # The path to the Logstash config for the main pipeline.
        config: /usr/share/logstash/pipeline
      pipeline:
        # ecs_compatibility: disabled
        ecs_compatibility: v8
        # Define the maximum number of events the filter and output plugins will accept each time
        # they run.
        batch:
          size: 125  # Events per batch per worker thread used by the pipeline.
          # Determine how long Logstash will wait to collect a full batch of events before
          # dispatching it for processing. If there are not enough events in the queue, a smaller
          # batch will be dispatched once the delay time period is passed.
          delay: 50  # In milliseconds.
      queue:
        # Determine the type of queue used by Logstash.
        type: "memory"
      EOF
    # Any Logstash configuration must contain at least one input plugin and one output plugin;
    # filters are optional.
    "logstash-pipeline.conf" = <<EOF
      input {
        # From where is the data coming.
        beats {
          port => 5044
          ssl => false
        }
      }
      #
      filter {
        grok {
          match => [
            # Filebeat sends its data as JSON, and the contents of the log line are contained in
            # the message field.
            "message",
            "\"app\":%%{QUOTEDSTRING:mem-app},\"level\":%%{QUOTEDSTRING:mem-level},\"message\":%%{QUOTEDSTRING:mem-message},\"requestId\":%%{QUOTEDSTRING:mem-requestId},\"service\":%%{QUOTEDSTRING:mem-service},\"timestamp\":\"%%{TIMESTAMP_ISO8601:mem-timestamp}\""
          ]
        }
        #
        mutate {
          # Remove the extra " in the value side of the key:value; e.g., "key":"\"value\""
          gsub => ["mem-app", "\"", ""]
          gsub => ["mem-level", "\"", ""]
          gsub => ["mem-message", "\"", ""]
          gsub => ["mem-service", "\"", ""]
          gsub => ["mem-requestId", "\"", ""]
        }
      }
      #
      filter {
        mutate {
          remove_field => ["agent", "stream", "input", "host", "tags", "ecs", "[kubernetes][node]",
                           "[kubernetes][namespace_labels]", "container", "[event][original]",
                           "message"]
        }
      }
      #
      output {
        elasticsearch {
          hosts => ["${var.es_hosts}"]
          index => "%%{[@metadata][beat]}-%%{[@metadata][version]}-%%{+YYYY.MM.dd}"
          template_overwrite => false
          manage_template => false
          ssl => false
        }
        # Send events to the standard output interface; the events are visible in the terminal
        # running Logstash.
        stdout {
          codec => rubydebug  # Help show the structure.
        }
      }
      EOF
  }
}
...
Beats
Beats are lightweight agents that are installed on nodes (servers) to collect different types of data for forwarding into the stack. As of this writing, there are seven officials Beats from Elastic:
- Auditbeat communicates directly with the Linux audit framework, collects the same data as auditd, and sends the events to the Elastic Stack in real time.
- Filebeat collects system and application log data from a range of locations such as files on disk, HTTP API endpoints, message streams (e.g. Kafka), and syslog listeners.
- Functionbeat deploys as a function in a cloud provider’s Function-as-a-Service (FaaS) platform to collect, ship, and monitor data from the cloud services.
- Heartbeat monitors services for their availability with active probing over ICMP, TCP, and HTTP protocols.
- Metricbeat collects systems and services metrics from a range of supported systems and protocols.
- Packetbeat collects and decodes real-time network packet information on a given host for analysis.
- Winlogbeat collects Windows event logs (such as system, application, security, and so on) from Windows-based infrastructures.
Filebeat
Whenever a containerized application writes to the stdout or stderr stream, the container runtime handles and redirects the output to the kubelet. The output is saved to a directory on the node; the location of the directory depends on the Operating System being used. Although different container runtimes implement this in different ways, the integration with the kubelet is standardized by the CRI logging format. Container logs are automatically rotated daily and every time the log file reaches 10MB in size.
Since logs are located in every node of the cluster, it is best to use a centralized, cluster-wide logging solution, to ensure all application logs are collected and permanently stored in a central location. This will allow you to examine historical logs and analyze trends as well as helping debug an application.
The first step in implementing a cluster-wide logging solution is to harvest the logs as soon as they appear in the file of any of the nodes in the cluster. We’ll accomplish this by deploying Filebeat as a DaemonSet. Since a DaemonSet ensures that all (or some) nodes run a copy of a pod, this ensures that there is a running instance of Filebeat on each node of the cluster. Once running, Filebeat will send the logs to Logstash for further processing; Filebeat can also send the logs to Elasticsearch directly, but in this implementation, Filebeat sends the logs to Logstash.
The file to create the resources for deploying Filebeat is located here. The excerpts below are from this file and are color-coded for easier reading.
...
resource "null_resource" "scc-filebeat" {
  provisioner "local-exec" {
    command = "oc apply -f ./modules/elk/filebeat/util/mem-filebeat-scc.yaml"
  }
  #
  provisioner "local-exec" {
    when = destroy
    command = "oc delete scc mem-filebeat-scc"
  }
}
...
resource "kubernetes_service_account" "service_account" {
  metadata {
    name = "${var.service_name}-service-account"
    namespace = var.namespace
    labels = {
      app = var.app_name
    }
    # annotations = {
      # "kubernetes.io/enforce-mountable-secrets" = true
  #   }
  }
  # secret {
  #   name = kubernetes_secret.rabbitmq_secret.metadata[0].name
  # }
}

resource "kubernetes_cluster_role" "cluster_role" {
  metadata {
    name = "${var.service_name}-cluster-role"
    labels = {
      app = var.app_name
    }
  }
  rule {
    # The core apiGroup, which has no name - hence the "".
    api_groups = [""]
    verbs = ["get", "watch", "list"]
    # The plural form must be used when specifying resources.
    resources = ["pods", "namespaces", "nodes"]
  }
  rule {
    api_groups = ["security.openshift.io"]
    verbs = ["use"]
    resources = ["securitycontextconstraints"]
    resource_names = ["mem-filebeat-scc"]
  }
}

resource "kubernetes_cluster_role_binding" "cluster_role_binding" {
  metadata {
    name = "${var.service_name}-cluster-role-binding"
    labels = {
      app = var.app_name
    }
  }
  # A RoleBinding always references a single Role, but it can bind the Role to multiple subjects.
  role_ref {
    api_group = "rbac.authorization.k8s.io"
    kind = "ClusterRole"
    # This RoleBinding references the Role specified below...
    name = kubernetes_cluster_role.cluster_role.metadata[0].name
  }
  # ... and binds it to the specified ServiceAccount in the specified namespace.
  subject {
    # The default permissions for a ServiceAccount don't allow it to list or modify any resources.
    kind = "ServiceAccount"
    name = kubernetes_service_account.service_account.metadata[0].name
    namespace = kubernetes_service_account.service_account.metadata[0].namespace
  }
}
...
resource "kubernetes_config_map" "config_files" {
  metadata {
    name = "${var.service_name}-config-files"
    namespace = var.namespace
    labels = {
      app = var.app_name
    }
  }
  data = {
    "filebeat.yml" = <<EOF
      # (1) The Modules configuration section can help with the collection, parsing, and
      # visualization of common log formats (optional).
      # (2) The Inputs section determines the input sources (mandatory if not using Module
      # configuration). If you are not using modules, you need to configure the Filebeat manually.
      filebeat.inputs:
        # Use the container input to read containers log files.
        - type: "container"
          # Change to true to enable this input configuration.
          enabled: true
          # Read from the specified streams only: all (default), stdout or stderr.
          stream: "all"
          # Use the given format when reading the log file: auto, docker or cri. The default is
          # auto; it will automatically detect the format.
          format: "auto"
          # The plain encoding is special because it does not validate or transform any input.
          encoding: "utf-8"
          # You must set ignore_older to be greater than close_inactive.
          ignore_older: "72h"
          close_inactive: "48h"
          scan_frequency: "10s"
          # To collect container logs, each Filebeat instance needs access to the local log's path,
          # which is actually a log directory mounted from the host. With this configuration,
          # Filebeat can collect logs from all the files that exist under the /var/log/containers/
          # directory.
          paths: ["/var/log/containers/*.log"]
          # By default, all events contain host.name. This option can be set to true to disable the
          # addition of this field to all events.
          publisher_pipeline.disable_host: false
          # If you define a list of processors, they are executed in the order they are defined
          # below.
          processors:
            - add_kubernetes_metadata:
                in_cluster: true
                host: $(NODE_NAME)
                default_matchers.enabled: false
                matchers:
                  - logs_path:
                      logs_path: "/var/log/containers/"
      # (3) The Processors section is used to configure processing across data exported by Filebeat
      # (optional). You can define a processor at the top-level in the configuration; the processor
      # is applied to all data collected by Filebeat. Furthermore, you can define a processor under
      # a specific input; the processor is applied to the data collected for that input.
      # (4) The Output section determines the output destination of the processed data. Configure
      # what output to use when sending the data collected by the beat. Only a single output may be
      # defined.
      # ------------------------------------ Logstash Output --------------------------------------
      output.logstash:
        enabled: true
        # The Logstash hosts without http:// or https://.
        hosts: ["${var.logstash_hosts}"]
        compression_level: 3
        escape_html: false
        # Number of workers per Logstash host.
        worker: 2
        loadbalance: false
        ttl: 0
        pipelining: 2
        index: "memories-filebeat"
        ssl:
          enabled: false
      setup:
        kibana:
          host: "${var.kibana_host}"
          path: "/kibana"
          ssl:
            enabled: false
      EOF
  }
}
...
# Deploy Filebeat as a DaemonSet to ensure there's a running instance on each node of the cluster.
# $ kubectl get ds -n memories
resource "kubernetes_daemonset" "daemonset" {
  metadata {
    name = var.service_name
    namespace = var.namespace
    labels = {
      app = var.app_name
    }
  }
  #
  spec {
    selector {
      match_labels = {
        # It must match the labels in the Pod template (.spec.template.metadata.labels).
        pod_selector_lbl = local.pod_selector_label
      }
    }
    # Pod template.
    template {
      metadata {
        labels = {
          app = var.app_name
          pod_selector_lbl = local.pod_selector_label
          fb_lbl = local.fb_label
        }
      }
      #
      spec {
        toleration {
          key = "node-role.kubernetes.io/master"
          operator = "Equal"
          effect = "NoSchedule"
        }
        service_account_name = kubernetes_service_account.service_account.metadata[0].name
        termination_grace_period_seconds = var.termination_grace_period_seconds
        host_network = var.host_network
        dns_policy = "ClusterFirstWithHostNet"
        container {
          name = var.service_name
          image = var.image_tag
          image_pull_policy = var.image_pull_policy
          security_context {
            run_as_non_root = false
            run_as_user = 0
            # By setting this property to true, the app will not be allowed to write to /tmp, and
            # the error below will be generated. To avoid the error, mount a volume to the /tmp
            # directory.
            read_only_root_filesystem = true
            privileged = true
          }
          # -c -> Specify the configuration file to use for Filebeat.
          # -e => Log to stderr and disables syslog/file output.
          # Location of our filebeat.yml file; MUST MATCH the mount_path in the volume_mount of
          # "config."
          args = ["-c", "/etc/filebeat.yml", "-e"]
          resources {
            requests = {
              # If a Container specifies its own memory limit, but does not specify a memory
              # request, Kubernetes automatically assigns a memory request that matches the limit.
              # Similarly, if a Container specifies its own CPU limit, but does not specify a CPU
              # request, Kubernetes automatically assigns a CPU request that matches the limit.
              cpu = var.qos_requests_cpu == "" ? var.qos_limits_cpu : var.qos_requests_cpu
              memory = var.qos_requests_memory == "" ? var.qos_limits_memory : var.qos_requests_memory
            }
            limits = {
              cpu = var.qos_limits_cpu
              memory = var.qos_limits_memory
            }
          }
          env {
            name = "NODE_NAME"
            value_from {
              field_ref {
                field_path = "spec.nodeName"
              }
            }
          }
          # In Linux when a filesystem is mounted into a non-empty directory, the directory will
          # only contain the files from the newly mounted filesystem. The files in the original
          # directory are inaccessible for as long as the filesystem is mounted. In cases when the
          # original directory contains crucial files, mounting a volume could break the container.
          # To overcome this limitation, K8s provides an additional subPath property on the
          # volumeMount; this property mounts a single file or a single directory from the volume
          # instead of mounting the whole volume, and it does not hide the existing files in the
          # original directory.
          volume_mount {
            name = "config"
            # Mounting into a file, not a directory.
            mount_path = "/etc/filebeat.yml"
            # Instead of mounting the whole volume, only mounting the given entry.
            sub_path = "filebeat.yml"
            read_only = true
          }
          volume_mount {
            name = "data"
            mount_path = "/usr/share/filebeat/data"  # Directory location on host.
            read_only = false
          }
          # /var/log/containers is one of a few filesystems that Filebeat will have access.
          # Notice that the volume type of this path is hostPath, which means that Filebeat will
          # have access to this path on the node rather than the container. Kubernetes uses this
          # path on the node to write data about the containers, additionally, any STDOUT or STDERR
          # coming from the containers running on the node is directed to this path in JSON format
          # (the standard output and standard error data is still viewable through the kubectl logs
          # command, but a copy is kept at this path).
          volume_mount {
            name = "containers"
            mount_path = "/var/log/containers/"
            read_only = true
          }
          volume_mount {
            name = "varlog"
            mount_path = "/var/log"
            read_only = true
          }
        }
        volume {
          name = "config"
          # A configMap volume will expose each entry of the ConfigMap as a file, but a configMap
          # volume can be populated with only part of the ConfigMap's entries.
          config_map {
            name = kubernetes_config_map.config_files.metadata[0].name
            # By default, the permissions on all files in a configMap volume are set to 644
            # (rw-r--r--).
            default_mode = "0600"  # Octal
            # Selecting which entries to include in the volume by listing them.
            items {
              # Include the entry under this key.
              key = "filebeat.yml"
              # The entry's value will be stored in this file.
              path = "filebeat.yml"
            }
          }
        }
        # The data folder stores a registry of read status for all files so that Filebeat doesn't
        # send everything again on a pod restart.
        volume {
          name = "data"
          host_path {
            # When Filebeat runs as non-root user, this directory needs to be writable by group
            # (g+w).
            path = "/var/lib/filebeat-data"
            type = "DirectoryOrCreate"
          }
        }
        volume {
          name = "containers"
          # A hostPath volume points to a specific file or directory on the node's filesystem. Pods
          # running on the same node and using the same path in their hostPath volume see the same
          # files.
          host_path {
            # Access the node's /var/lib/docker/containers.
            path = "/var/log/containers/"  # Directory location on host.
          }
        }
        volume {
          name = "varlog"
          host_path {
            path = "/var/log"
          }
        }
      }
    }
  }
}
Creating the service account, role, and role binding for the Security Context Constraint (SCC). Note that this SCC will be applied at the cluster level, hence, we should ensure that ClusterRole permissions are as limited as possible. If one of the pods associated with this service account gets compromised, then the attacker would not be able to gain access to the entire cluster.
- To configure Filebeat, edit the configuration file filebeat.yml. For a sample configuration file, please see filebeat.reference.yml, and for more information on how to configure Filebeat, go here.
- To configure Filebeat manually, you specify a list of inputs in the
filebeat.inputssection of thefilebeat.yml config file; go here for more information. - The Processors section of the
filebeat.ymlconfig file is used to configure processing across data exported by Filebeat. For a list of type of processors, go here. - The Output section of the filebeat.yml config file determines the output destination of the processed data. Only a single output may be defined. See configuring output for more information.
- Kibana dashboards are loaded into Kibana via the Kibana API. This requires a Kibana endpoint configuration. You configure the endpoint in the
setup.kibanasection of thefilebeat.ymlconfig file. See setup Kibana endpoint for more information.
Filebeat will be deployed as a DaemonSet to ensure there’s a running instance on each node of the cluster.
Note: If running on Red Hat OpenShift, please see the configuration requirements.
toleration – Kubernetes master nodes can use taints to limit the workloads that can run on them. To run Filebeat on master nodes you may need to update the Daemonset spec to include proper tolerations. For more information, go here. To list the taints on nodes:
$ kubectl describe nodes | grep -e Name: -e Taints:
PS> kubectl describe nodes | select-string -pattern 'Name:','Taints:' -CaseSensitive
host_network – If set to true, the pod gets to use the node’s network interfaces instead of having its own set; i.e., the pod does not get its own IP address, and if it runs a process that binds to a port, the process will be bound to the node’s port.
dns_policy – For Pods running with hostNetwork, you should explicitly set its DNS policy to ClusterFirstWithHostNet. Otherwise, Pods running with hostNetwork and ClusterFirst will fallback to the behavior of the Default policy. See Pod’s DNS Policy for more information.
security_context – Filebeat needs to run as admin. Furthermore, Filebeat needs extra configuration to run in the Openshift environment; enable the container to be privileged as an administrator for Openshift. If the container does not run as privileged, the filebeat pods enter in CrashLoopBackOff status, and the following error appears:
Exiting: Failed to create Beat meta file: open
/usr/share/filebeat/data/meta.json.new: permission denied
Finally, once the Filebeat DaemonSet is deployed, you can check the deployment of the pods by executing the two commands below. Figure 2 below shows the output from these commands.
$ kubectl get nodes -o wide
$ kubectl get pods -o wide -n memories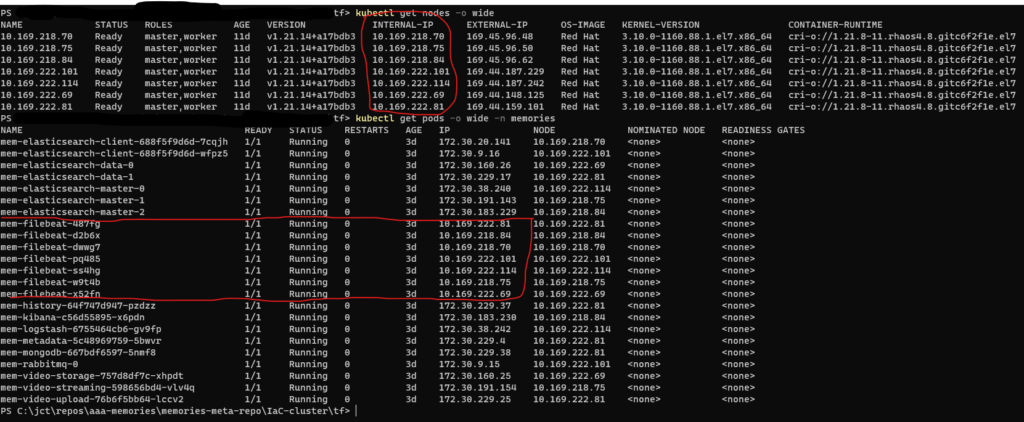
Kibana
Kibana is a visualization layer that works on top of Elasticsearch, providing users with the ability to analyze and visualize the data. Commonly known as the charting tool for the Elastic Stack, Kibana also acts as the user interface for monitoring, managing, and securing an Elastic Stack cluster. For more information, see What is Kibana? To use this tool effectively, you’ll need to familiarize yourself with some of the basic steps; for a quick start, go here.
The file to create the resources for deploying Kibana is located here.
Conclusion
Deploying the ELK Stack took much longer than expected, but it is now available for implementing distributed tracing. Next, in Part 6, you will deploy the message broker RabbitMQ to send asynchronous messages among the microservices.